How to Measure Website Personalization ROI: The Seven Metrics RevOps Teams Should Track
Short answer: To measure website personalization ROI, compare a personalized experience against a holdout group that sees the default site, and track seven metrics: conversion rate, identification (match) rate, engagement rate, meetings created, pipeline influenced, sales-cycle length, and dismissal rate. Run the test for at least four weeks and until each group has enough conversions to be trustworthy. Without a holdout, you are measuring seasonality, not personalization.
Why Personalization Is Hard to Prove
Launching a popup or a personalized microsite takes minutes. Proving it worked takes discipline. Traffic mix shifts, campaigns end, and quarter-end changes behavior. Teams that compare this month to last month often credit personalization for gains that came from a product launch, or blame it for dips caused by a holiday. A holdout group fixes this by running both experiences at the same time.
The Seven Metrics
1. Conversion rate
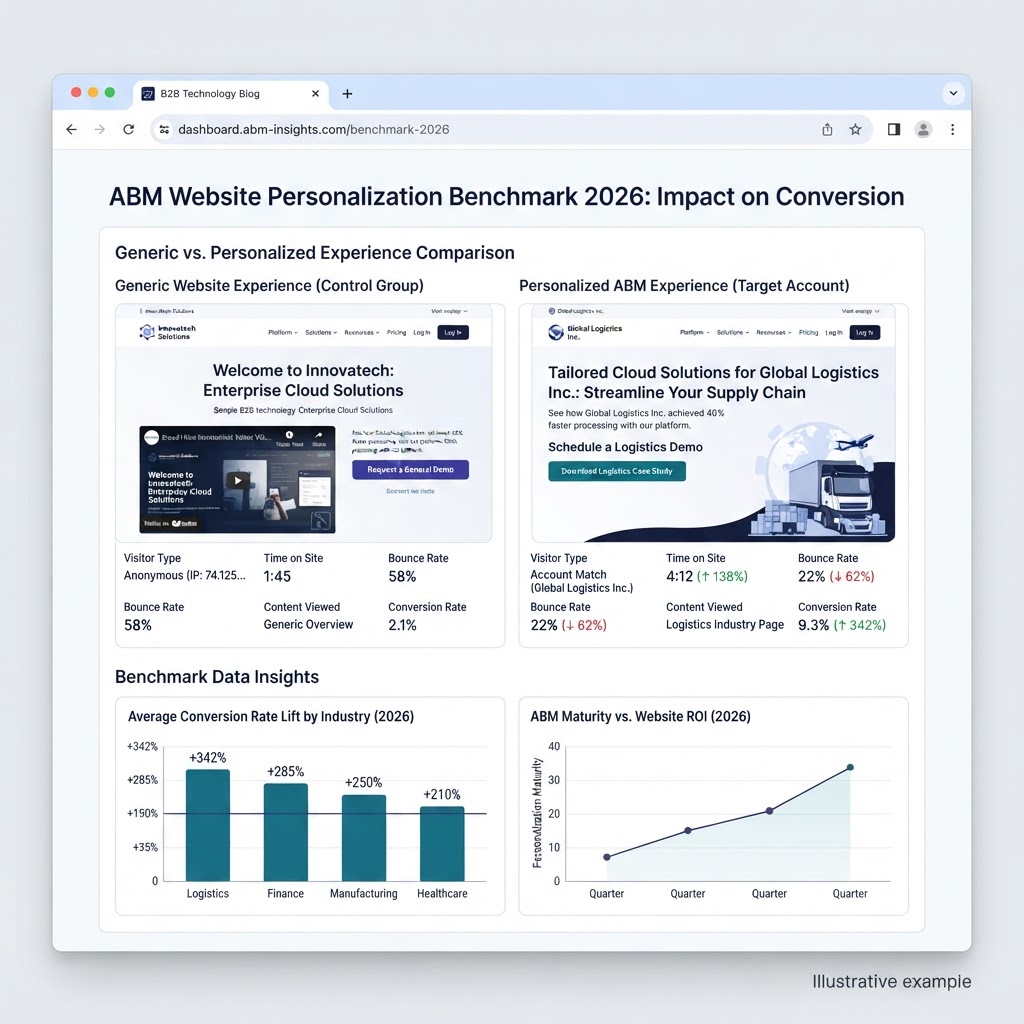
Conversions divided by unique visitors in each group, for a defined goal such as demo request. This is your headline number. For context on typical ranges, see our 2026 B2B conversion benchmarks, and remember that B2B site-wide conversion rates are typically low single digits.
2. Identification (match) rate
The share of visitors resolved to a company or person. De-anonymization uses IP-to-company matching and reverse DNS, with person-level identification available through Warmly. Match rates vary by audience, geography, and remote-work share, so track yours monthly. A higher match rate widens the audience your personalization can reach.
3. Engagement rate
Popup clicks or microsite interactions divided by impressions. It is a leading indicator: if engagement is low, conversion will not follow. Break it out by trigger (scroll depth, time-on-page, exit intent, account tier) to learn which signals deserve more budget.
4. Meetings created
The count of qualified meetings sourced from personalized experiences. This metric speaks to sales leadership because it ties to capacity, not clicks.
5. Pipeline influenced
Opportunity value where the account saw a personalized experience before the opportunity was created. Label it "influenced," not "sourced," unless your attribution model supports the stronger claim.
6. Sales-cycle length
Days from first identified visit to closed-won, compared between exposed and unexposed accounts. Personalization often shortens the cycle because buyers see relevant proof earlier. Expect this to take a full quarter or more to show up.
7. Dismissal and complaint rate
A guardrail metric. If dismissals rise or users complain, you may be over-messaging. Cap frequency and exclude sensitive segments.
How to Run a Clean Holdout Test
- Pick one change. Test a single popup or microsite so you know what drove results.
- Split randomly. Hold out 10 to 20 percent of eligible traffic. Keep the split consistent per visitor.
- Run for four weeks minimum. This covers weekly cycles and smooths campaign noise.
- Wait for enough conversions. A common rule of thumb is at least 100 conversions per variant before trusting a difference.
- Segment the readout. Look at target accounts separately from all traffic, because lift concentrates where relevance is highest.
What Good Results Can Look Like
Results vary widely by site and offer, so treat any benchmark as a hypothesis. Upvert's published analysis reported 15 to 22 percent conversion increases from combining de-anonymization with smart popups. Use ranges like that to set expectations, then let your own holdout decide.
Reporting to Finance
Finance wants cost, lift, and payback. Express results as incremental meetings and influenced pipeline per month against the platform cost, then show payback period. Plans start at $99/month, so the bar for payback is typically a small number of incremental qualified meetings. Sync results to HubSpot or Salesforce so the numbers live where finance already looks.
Frequently Asked Questions
How do you measure website personalization ROI?
Compare a personalized experience with a holdout group on conversion rate, meetings created, and pipeline influenced, over at least four weeks.
What is a good conversion lift from personalization?
It varies by site. Upvert's published analysis reported 15 to 22 percent lifts from de-anonymization paired with smart popups, but your own holdout test is the reliable answer.
How long should a personalization test run?
At least four weeks, and until each variant has roughly 100 or more conversions.
What is a holdout group?
A randomly selected share of visitors who see the default experience, used as a baseline to isolate the effect of personalization.
Which tools does Upvert integrate with?
HubSpot, Salesforce, and Slack, with Warmly powering person-level identification.
Want a measurement plan for your own traffic? Book a demo or start for free.